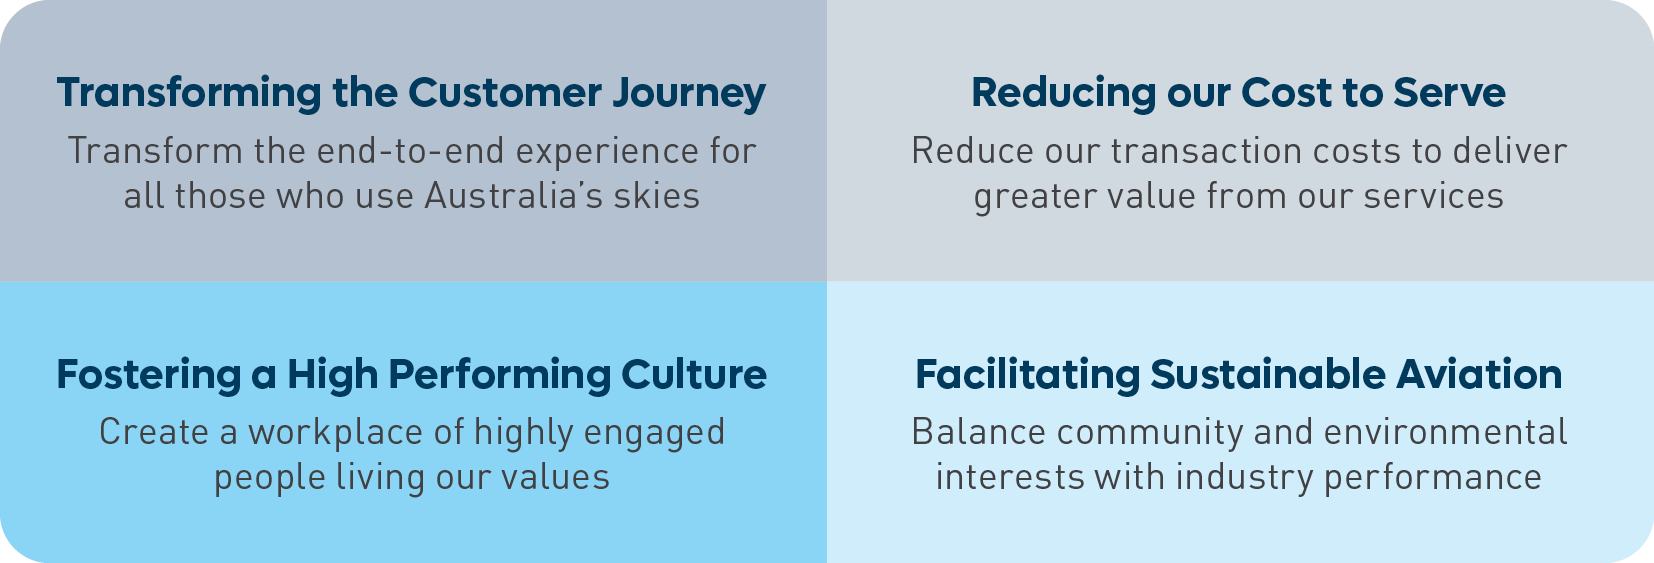
Our strategic performance measures ensure we continue to be recognised as an industry leader and valued service provider.
Our Performance Domains
Achieving our ambitions through our transformation investment outcomes, can be measured through 4 focused performance domains and targeted supporting KPIs, which are outlined in the Performance section.
Our Key Performance Indicators
Our strategic performance is focused on 8 enterprise-wide key performance indicators (KPIs). These indicators will monitor how we are progressing in achieving our performance outcomes and ensure we continue to be recognised as an industry leader and valued service provider. The baseline is set using our most recent performance metrics and our targets drive improvement in our performance over time.
TABLE 1: Corporate Plan KPIs
| PERFORMANCE OUTCOMES | KPI | BASELINE | FY2022-23 to FY2026-27 TARGETS |
|---|---|---|---|
| Transforming the Customer Journey | Significant Attributable Safety Occurrences | 0 | No significant attributable safety occurrences |
| Planned Capacity Delivered as Percentage of Time* | 75% | Meet planned capacity greater than 75% of time as traffic grows | |
| Customer Satisfaction Score | 81% | Improve satisfaction to 85% or above by 2027 | |
| Reducing the Cost to Serve | Real Price Growth (5-year trend) | Less than 0% | Price growth to stay below inflation |
| Return On Assets | -25.5% | Improve our return to match a reasonable rate over time | |
| Fostering a High Performing Culture | People Engagement | 69% | Improve engagement to be greater than 75% over time |
| Total Recordable Injury Frequency | 7.0 | Drive TRIFR performance downward year on year towards zero | |
| Facilitating Sustainable Aviation | Total Environmental Footprint | 241,510 tCO2e | Reduce our footprint by 10% by 2025-26 |
*This metric better represents Airservices contribution to industry capacity and replaces On Time Performance.
