2% increase
From pre-pandemic (2018-19)
We continue to keep our skies safe and to deliver efficient services.
compared to 2022-23
Top 4 airports combined increased by 8.9% comprising:
10.8% increase in Melbourne
10.0% increase in Brisbane
5.4% increase in Sydney
(Kingsford Smith)
12% increase in Perth
Domestic aviation traffic
2% increase
From pre-pandemic (2018-19)
International aviation traffic
5% reduction
From pre-pandemic (2018-19)
General aviation
10% reduction
From pre-pandemic (2018-19)
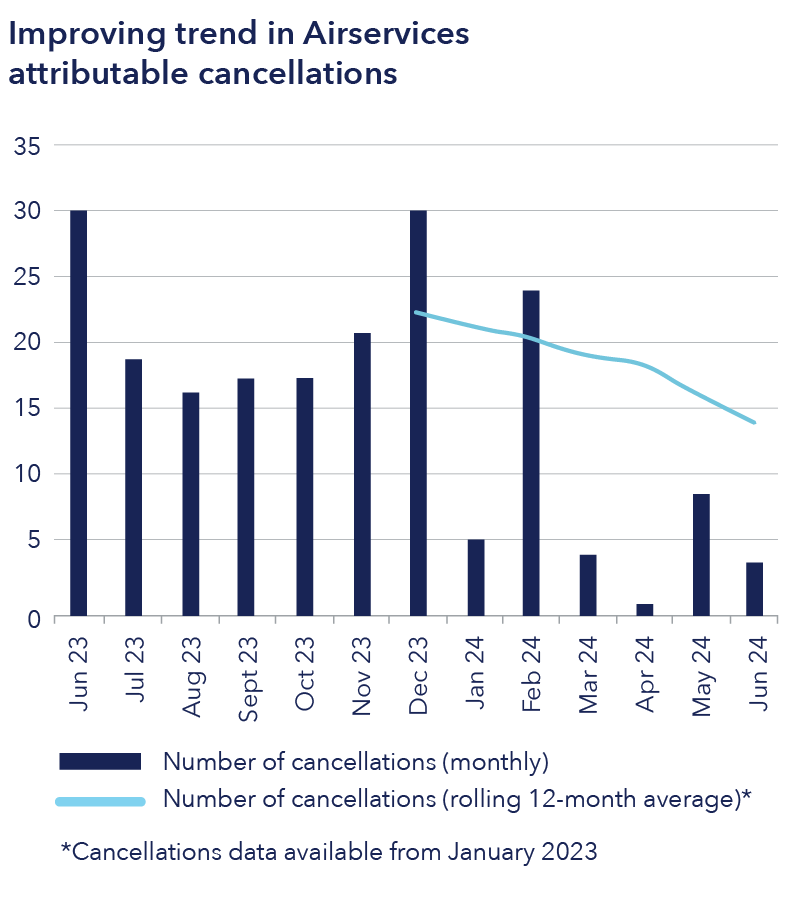
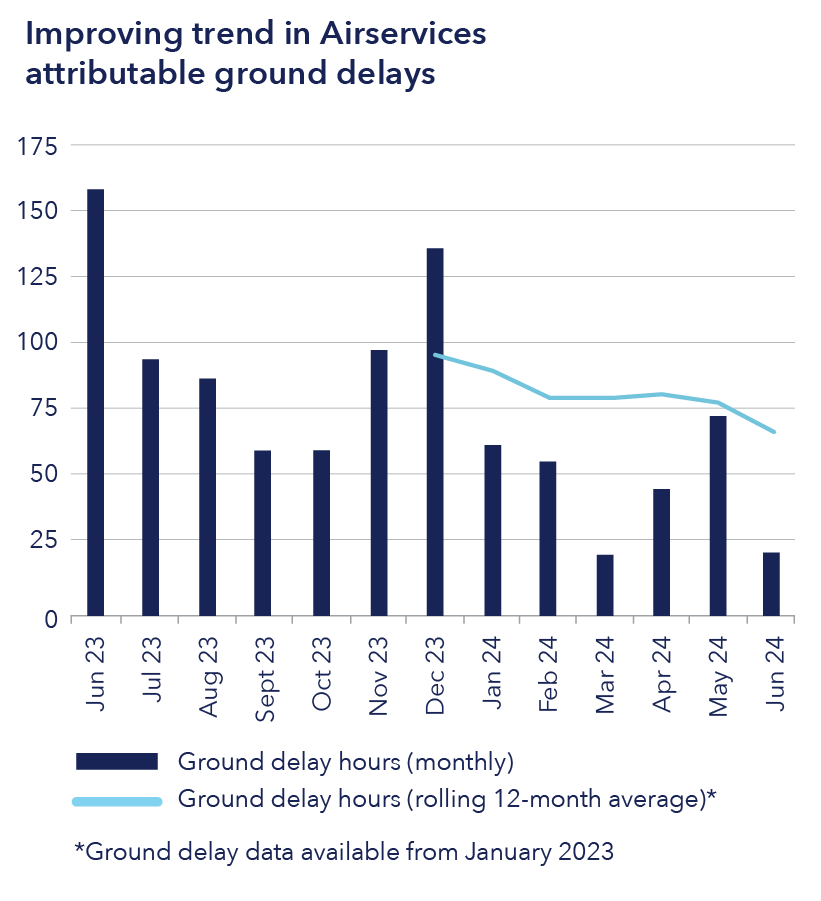
Traffic patterns improved across the Australian aviation network during the year, and we prioritised our focus on improving service performance while delivering our services safely and efficiently.
We recognised that our service reliability did not consistently meet the high standards expected by our customers and stakeholders, nor the standards we expect of ourselves.
Throughout the year, we worked on building our service resilience and adding flexibility to increase operational capacity. We invested in infrastructure and frontline service improvements to strengthen our service delivery capabilities, building resilience to meet the needs of our owner, customers and communities.


Like other organisations within the aviation sector ecosystem, our financial performance continues to remain challenging, with some volatility in traffic recovery during the year.
(21% improvement
compared to 2022-23)
We are continuing our culture transformation journey to build a safe and inclusive workplace for all.